
Add Context, and Stock Market Valuations are Fair
We agree with the consensus view that stock valuations are elevated by traditional measures. But valuations should be considered in the context of the economic regime and earnings environment. Factoring in outlooks for economic growth, inflation, interest rates, and earnings, we are comfortable with the current 21 price-to-earnings ratio (P/E) for the S&P 500 Index. To justify a higher P/E and further moves higher from here, assumptions must be made about the path that these key drivers will take in coming months. We expect more of these factors to break positively than negatively, but it seems clear that a lot of optimism is currently being priced in. When the next bear market might arrive and where valuations will be at that time is difficult, if not impossible, to predict, but our best guess is that this bull market extends through 2027 (we define a bear market as a 20% decline on the S&P 500 based on closing prices). Gains beyond that will depend on whether the economy continues to grow, the path of interest rates and inflation, and the productivity gains (and potentially unemployment) AI brings.
Starting With the Basics: Price-to-Earnings Ratio
Before digging into what we think this stock market is worth, it’s important to recognize that valuations have not historically been good timing tools. There is essentially no correlation between valuations and where stocks will go over the subsequent year. However, P/Es have value as a basic valuation tool, especially as it pertains to predicting long-term returns. But it requires context. It’s easy to say that the S&P 500 at a forward P/E of over 21 (based on the consensus S&P 500 earnings per share estimate for the next 12 months) is high based on historical averages. But this approach importantly lacks context around where we are in the economic cycle, the levels and outlooks for inflation, interest rates, earnings, and corporate America’s capital intensity.
Perhaps the easiest one of these drivers to tackle is rates. A higher 10-year Treasury yield has historically correlated with lower P/Es, as shown in the “Higher Yields Tend to Drag Down Stock Valuations” chart. This intuitively reflects the time value of money — future earnings (or cash flows) are worth less today at higher interest rates than they would be at lower rates, and the required return threshold to justify equity risk is higher.
Higher Yields Tend to Drag Down Stock Valuations
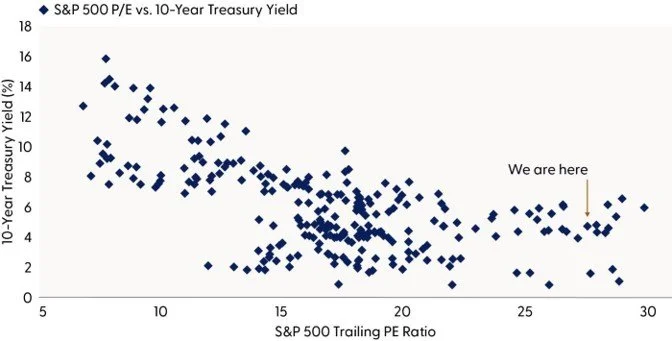
Source: LPL Research, Bloomberg, FactSet, 05/26/26 (data covers 1962 to present)
Disclosures: All indexes are unmanaged and cannot be invested in directly. Past performance is no guarantee of future results.
The Equity Risk Premium Has Effectively Been Erased
A way to capture yields and P/Es together is with the equity risk premium (ERP). This calculation compares the earnings yield from stocks (earnings / price rather than price / earnings) to the 10-year Treasury yield. As shown in the “Stock Valuations are High Relative to Bonds” chart, the ERP based on consensus earnings estimates for the next 12 months is barely positive at just 0.2%, compared to the long-term average of 2.5%. That means that investors in the S&P 500 are not expected to earn more per dollar than they would from Treasuries. Even though stock returns over the long-term have far outpaced bond returns, at current prices, theoretically those returns are expected to be closer.
Before you think about selling stocks because of valuations, keep in mind valuations are not predictive over shorter time periods. Additionally, inputs into these calculations change over time. Our expectation is that currently elevated yields will be temporary. If yields come down as oil prices normalize, equities will offer more compensation for the risk. And if recent history is a guide, earnings will be higher as well, sending earnings yields higher.
Bottom line, we expect a more positive earnings yield after the Iran conflict is resolved and the Strait of Hormuz opens to support further, albeit potentially modest, additional stock market gains.
Stock Valuations are High Relative to Bonds
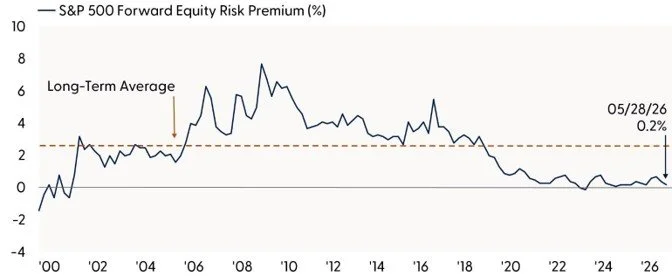
Source: LPL Research, FactSet, 05/26/26
Disclosures: All indexes are unmanaged and cannot be invested in directly. Past performance is no guarantee of future results. Estimates may not materialize as predicted and are subject to change. Equity risk premium is earnings (E) divided by price (P) minus the 10-year Treasury yield.
Supportive Economic Cycle
The next key question we ask is whether economic conditions are supportive. We believe they are, particularly in terms of growth. Bolstered by fiscal stimulus from the One Big Beautiful Bill Act (OBBBA) and massive AI investment, LPL Research expects the U.S. economy to grow by 2% in 2026 (measured by real gross domestic product (GDP)), even if oil prices stay elevated for several more weeks.
In our latest Economic Navigator, LPL’s Chief Economist Dr. Jeffrey Roach explains that geopolitical conflict and commodity supply shocks might shave 0.3% to 0.4% off economic growth over the next two quarters, not nearly enough to bring recession into play. Despite these pressures, underlying demand remains firm, suggesting continued economic expansion.
Inflation is the bigger concern. We expect supply-driven shocks to push prices higher, potentially adding close to a percentage point to inflation if commodity costs stay elevated. As a result, the Federal Reserve is likely to stay on hold to assess upside inflation risks. The framework of an Iran deal that emerged last week and resulting dip in oil prices are encouraging in this regard.
As the “Inflation is an Enemy of Stock Valuations” chart illustrates, higher inflation tends to bring stock valuations down. While part of this relationship reflects higher interest rates, inflation can also slow growth and pressure profit margins if pricing power is limited. Although margins are expanding now despite high inflation, boosted by AI investment, this relationship fundamentally extends beyond rates alone.
Inflation is an Enemy of Stock Valuations
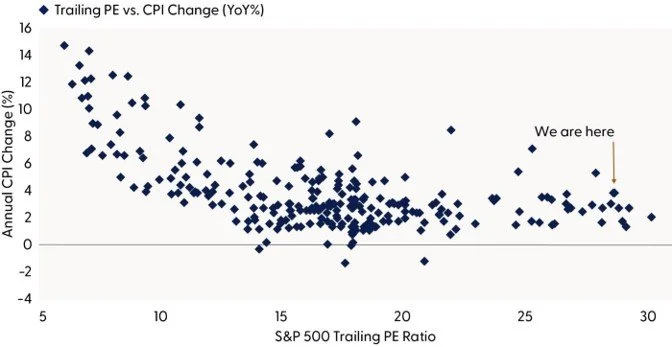
Source: LPL Research, Bloomberg, FactSet, 05/26/26 (Data covers 1962 to present) Disclosures: All indexes are unmanaged and cannot be invested in directly. Past performance is no guarantee of future results.
Cash Flow Matters
We’ve focused mostly on earnings, but cash flow provides a more complete picture. Substantial capital investment can depress cash flows, but that investment can be depreciated over time, reducing the drag on earnings (which can be misleading at times). So, while earnings drive stock prices over time, assessing future cash flow prospects is more difficult, but commonly perceived as a purer, more robust valuation method.
This is where the valuation discussion gets interesting. The previously capital-light hyperscalers are now capital-intensive and massive AI investments have essentially wiped out otherwise generated cash flows. The “Hyperscaler Investment Binge Has Pressured Free Cash Flow Valuations” chart illustrates that when cash flows are depressed, the free cash flow yield (free cash flow divided by price) falls, making stocks appear more expensive and pushing the S&P 500’s current free cash flow (FCF) yield to 3.4%. This is below the post-1999 average of 5.4% (a higher FCF yield is more attractively valued), and comparable to levels observed during the dotcom peak.
However, one key difference today is that the companies making massive investments have some of the strongest balance sheets and the most cash-flow-generating ability ever achieved. If AI investments deliver as expected and capital spending eventually slows, cash flow generated down the road will be significant and could provide valuation support. While we fully acknowledge the risk of wasteful technology spending, we would argue it’s too early to say these stocks are expensive because of heavy capital investment.
Hyperscalers’ Investment Binge Has Pressured Free Cash Flow Valuations
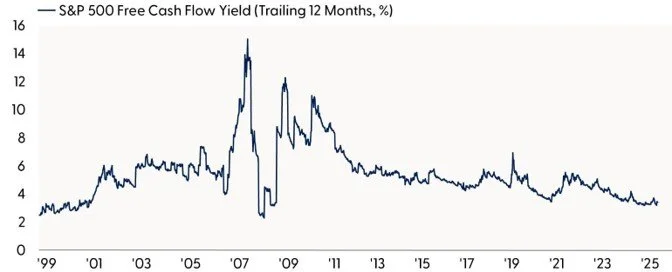
Source: LPL Research, FactSet, 05/26/26
Disclosures: All indexes are unmanaged and cannot be invested in directly. Past performance is no guarantee of future results. Free cash flow yield is operating cash flow minus capital expenditures divided by price.
Fair Value at Year End is Probably Higher Still
While equity valuations appear elevated across most traditional metrics, they are not disconnected from the broader macro and earnings backdrop. Today’s P/E multiple reflects a market pricing in continued economic resilience, eventual inflation moderation, lower interest rates, and meaningful AI productivity gains. That said, the margin for error is thin. With the ERP near zero and cash flow pressured by heavy capital spending, future gains will likely depend on policymakers effectively managing inflation and rates, and from corporations translating investment into durable earnings and cash flow growth.
Importantly, elevated valuations do not signal an imminent market reversal. Markets can sustain higher multiples longer than expected when supported by solid fundamentals, though they are also more vulnerable to shocks when optimism is fully priced in. As this cycle evolves, monitoring the trajectory of rates, inflation, and earnings will be critical. Ultimately, valuations may not dictate near-term direction but may shape opportunities and risks ahead.
Given much stronger than expected earnings growth and the continued ramp in AI spending we saw during the first quarter earnings season, it would not be a surprise to see S&P 500 earnings per share in the neighborhood of $320 or higher in 2026 and over $350 in 2027. While our estimated year-end fair value range for the index is currently under review, a 22 P/E would place index fair value potentially in the range of 7,700 to 7,800. If corporate America’s spending plans are close to what has been communicated, the calculus for at least $350 per share in earnings in 2027 seems justifiable, while AI disappointments or an extended closure of the Strait of Hormuz could challenge this view.
Overall, modestly higher stock valuations are possible but expect earnings and cash flow growth to do the heavy lifting. In our view, this stock market is fairly valued at its current forward P/E (21 to 22) and further gains through year-end will likely be driven by positive surprises on AI adoption.
Asset Allocation Insights
LPL’s Strategic and Tactical Asset Allocation Committee (STAAC) maintains its recommendation for a tactical equity overweight and fixed income underweight. This reflects an expectation of further easing of geopolitical and commodity supply concerns as a result of the U.S.-Iran conflict, alongside a more cautious outlook for select areas of core fixed income. Overall, our tactical views emphasize a modest equity overweight led by large cap growth, a continued focus on quality bond sectors, caution in rate-sensitive fixed income sectors, and an ongoing allocation to diversifying strategies and alternatives.
Within equity sectors, the Committee remains overweight technology, supported by the sector’s strong and accelerating earnings outlook and abating AI investment skepticism. At the same time, given the magnitude of recent gains in semiconductor stocks, some consolidation of those gains is anticipated. The STAAC also maintains an overweight stance towards industrials on strong earnings momentum, favorable technicals, and continued tailwinds from fiscal spending and AI investment. On the other hand, the Committee remains underweight consumer discretionary and real estate on sub-par technicals and uncompelling valuations.
Important Disclosures
This material is for general information only and is not intended to provide specific advice or recommendations for any individual. There is no assurance that the views or strategies discussed are suitable for all investors or will yield positive outcomes. Investing involves risks including possible loss of principal. Any economic forecasts set forth may not develop as predicted and are subject to change.
References to markets, asset classes, and sectors are generally regarding the corresponding market index. Indexes are unmanaged statistical composites and cannot be invested into directly. Index performance is not indicative of the performance of any investment and do not reflect fees, expenses, or sales charges. All performance referenced is historical and is no guarantee of future results.
Any company names noted herein are for educational purposes only and not an indication of trading intent or a solicitation of their products or services. LPL Financial doesn’t provide research on individual equities.
All information is believed to be from reliable sources; however, LPL Financial makes no representation as to its completeness or accuracy. All investing involves risk, including possible loss of principal.
US Treasuries may be considered “safe haven” investments but do carry some degree of risk including interest rate, credit, and market risk. Bonds are subject to market and interest rate risk if sold prior to maturity. Bond values will decline as interest rates rise and bonds are subject to availability and change in price.
The Standard & Poor’s 500 Index (S&P500) is a capitalization-weighted index of 500 stocks designed to measure performance of the broad domestic economy through changes in the aggregate market value of 500 stocks representing all major industries.
The PE ratio (price-to-earnings ratio) is a measure of the price paid for a share relative to the annual net income or profit earned by the firm per share. It is a financial ratio used for valuation: a higher PE ratio means that investors are paying more for each unit of net income, so the stock is more expensive compared to one with lower PE ratio.
Earnings per share (EPS) is the portion of a company’s profit allocated to each outstanding share of common stock. EPS serves as an indicator of a company’s profitability. Earnings per share is generally considered to be the single most important variable in determining a share’s price. It is also a major component used to calculate the price-to-earnings valuation ratio.
All index data from FactSet or Bloomberg.
For public use. Member FINRA/SIPC.
RES-0007122-0526Tracking#1117066|#1117067(Exp.06/27
This research material has been prepared by LPL Financial LLC.